For audiophiles, reading a good speaker review can activate the salivary glands. I don’t know if it’s because we like to live vicariously, imagining the experience of having equipment for too expensive for any rational man to own, or because we need some sort of validation on equipment we own. Whatever the real reasons may be, once the review is over, you’ll often be greeted by a series of graphs and charts.
Speaker companies, and most of the pro reviewers who do measurements, measure the response of speakers both on-axis and off-axis. Harman takes it to the extreme by measuring speakers on-axis, then off-axis in 10-degree increments in a 360-degree circle both horizontally and vertically. Often some of these measurements are combined to create an averaged response across a “listening window.” Past practice at S&V was to average the results at 0°, ±10°, ±20°, and ±30° horizontally. With the merger of S&V and Home Theater, this practice will be changing to the standard employed by Home Theater and sister publication Stereophile: an average of 0°, ±15° horizontally, and ±15° vertically.
Wait a minute! The measurements published for speakers are not the same averages? Two reputable audio publications measured things differently! Sound and Vision published averages for up to 30° off-axis and Stereophile measured only up to 15°.
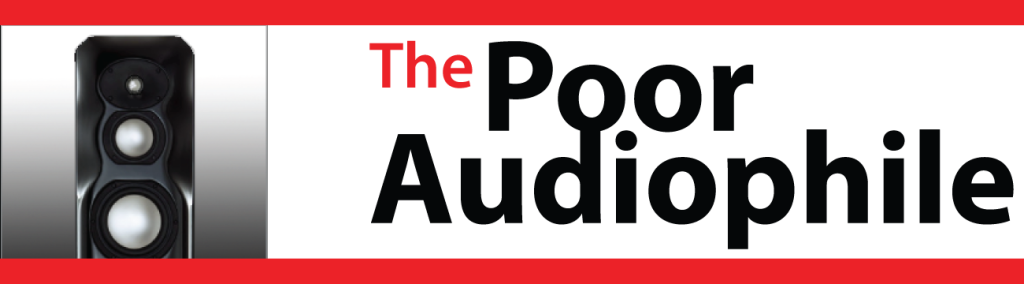
Moreover, measuring the same speaker in an anechoic environment vs a quasi-anechoic environment (a half-million dollar facility vs. outdoors) produces startlingly different results.
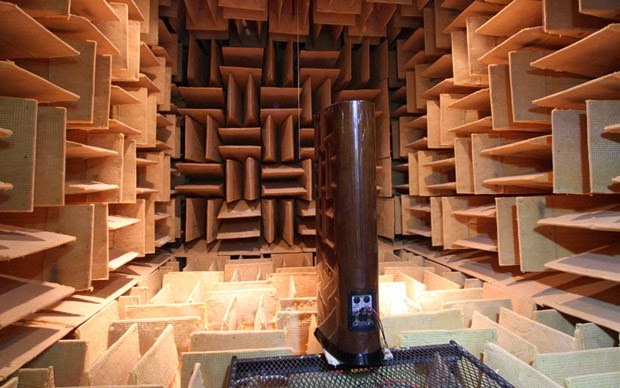
Here, Brent measured one of the new Revel Performa F208. The former graph is in Harman’s anechoic chamber and the second is the quasi-anechoic environment of his back yard.


While there is some correlation between the two graphs, there are also some startling differences. And to even get those quasi-anechoic results, Brent had to do some seemingly extreme (and funny) setup as you see in the photo below:
The article goes on and is a great read for any audiophile. Nevertheless, the bottom line that I took away is to beware of any measurements posted online or in forums by so-called speaker ‘experts’. In fact, unless the methodology of how the measurements were taken is stated in the review I’ll be viewing them with some suspicion. I do want to tip my had to the publications (Stereophile and Sound and Vision included) that are part of the SoundStage network. They actually publish the speakers that they have measured in an anechoic chamber. You can see the list here and there is a link to the measurements of each speaker including the measurements at their various on and off-axis angles.
Thanks to Brent for putting together a great article. Now if someone could just tell me about those darn waterfall measurements 😉

 review: The perfect audiophile streaming speaker")


 and Edge NQ network streamers gain Roon support")


 and Edge NQ network streamers gain Roon support")
 review: The perfect audiophile streaming speaker")
Hi! Thanks for your kind words and for reading my article all the way through and for making some insightful points!
One quick note: That quasi-anechoic measurement chart you show isn't meant to be valid below 200 Hz or so – you'd use ground plane or close-mic to do the <200 Hz measurement, then splice then. But it does reveal the weakness of quasi-anechoic measurements between about 200 and 500 Hz.
Waterfall charts are cool because they show resonances. Most importantly, they tend to reveal vibrations in a speaker's cabinet. Unfortunately, I'm not aware of any studies that have been done to correlate the measurements with subjective impressions. Which is not in any way to imply no such study exists or that the measurements don't correlate!
Brent, it was a really, really great piece of work. I love following your articles. Keep up the great work.
That is also a nice-to-know point about the sub 200 Hz measurements in a quasi-anechoic environment. Good to know about the waterfall charts and their association with cabinet vibrations. I know that specifically has been a major focus of Wilson speakers. The folks over at Harman may have some studies on that topic. I very vaguely recall—and I could be wrong— that Kevin Voecks talked about the cabinet resonance issue with the launch of the Ultima2 line and how they had tackled that when the products were launched back in '97. Then again, he may have simply mentioned it as a statement and didn't correlate it as you point out.
I really appreciate the post here and your comments 🙂
We've actually done two studies on the perception and detection of resonances.
1) "The Modification of Timbre by Resonances: Perception and Measurement"
http://www.aes.org/e-lib/browse.cfm?elib=5163
2) The Detection Thresholds of Resonances at Low Frequencies
http://www.aes.org/e-lib/browse.cfm?elib=7868
The first study focussed on measuring the detection thresholds of resonances (delayed and undelayed) above 125 Hz. The second study focussed on resonances (both peaks and dips) at low frequencies. You can download a free copy of the first paper from the Harman website.
http://www.harman.com/EN-US/OurCompany/Innovation/Pages/WhitePapers.aspx?CategoryID=White%20papers
The research shows that the audibility of resonances depends on its frequency, Q factor (width of the peak or dip), its level (dB), and the type of music (impulsive versus steady-state). At low frequencies, we showed that for medium-wide Q resonances, dips are as equally audible as peaks. So the visual evidence of a resonance on a graph is not a good indicator of its audibility. Low Q resonances are more audible than high Q resonances at a given level. Adding reflections to the recording or listening room can actually increase the audibility of low-medium Q resonances. Pink noise was found to be the most revealing signal of the presence of resonances, Tracy Chapman's Fast Car was a very close second.
Dr. Olive, thanks for those references and I'm looking forward to checking out those links. I'm not (yet) an Audio Engineering Society member but I think you're tempting me. I may highlight those research studies in a future article.
I don't think that I'll now ever be able to listen to Pink noise without thinking about Tracy Chapman's "Fast Car" and, somehow, I think I'm now always going to associate her song with pink noise going forward. 🙂 I'm a big fan of the work you all are doing over at Harman.
Comments are closed.